Welcome to
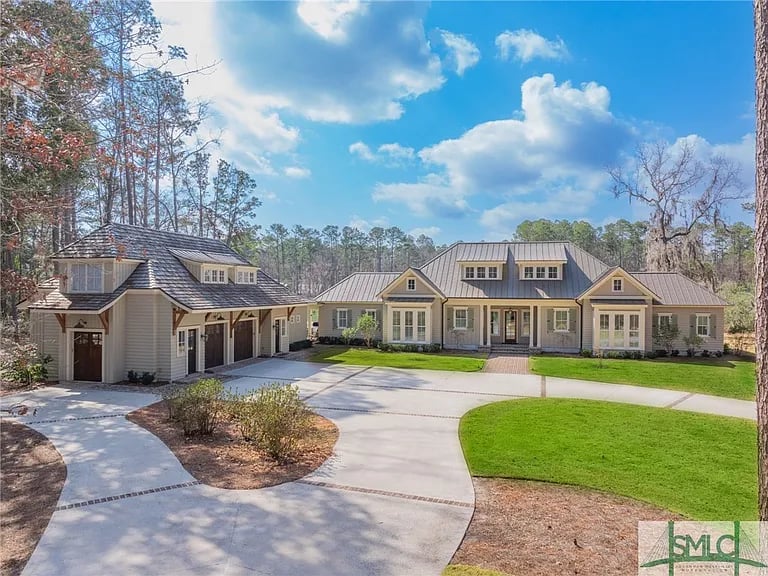
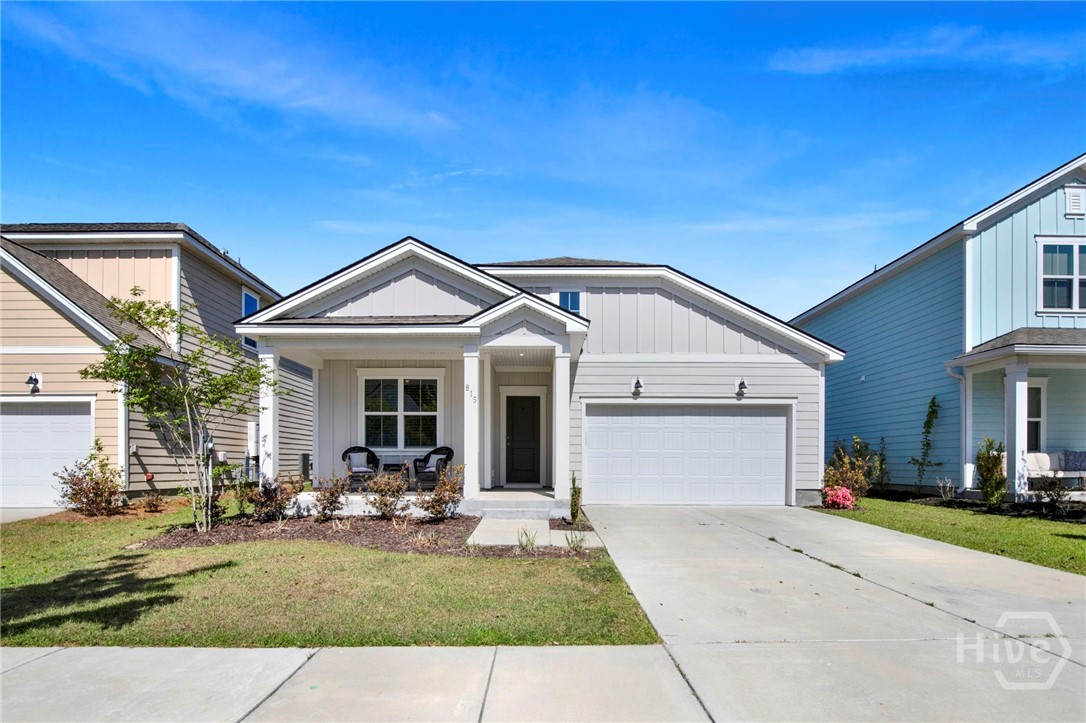
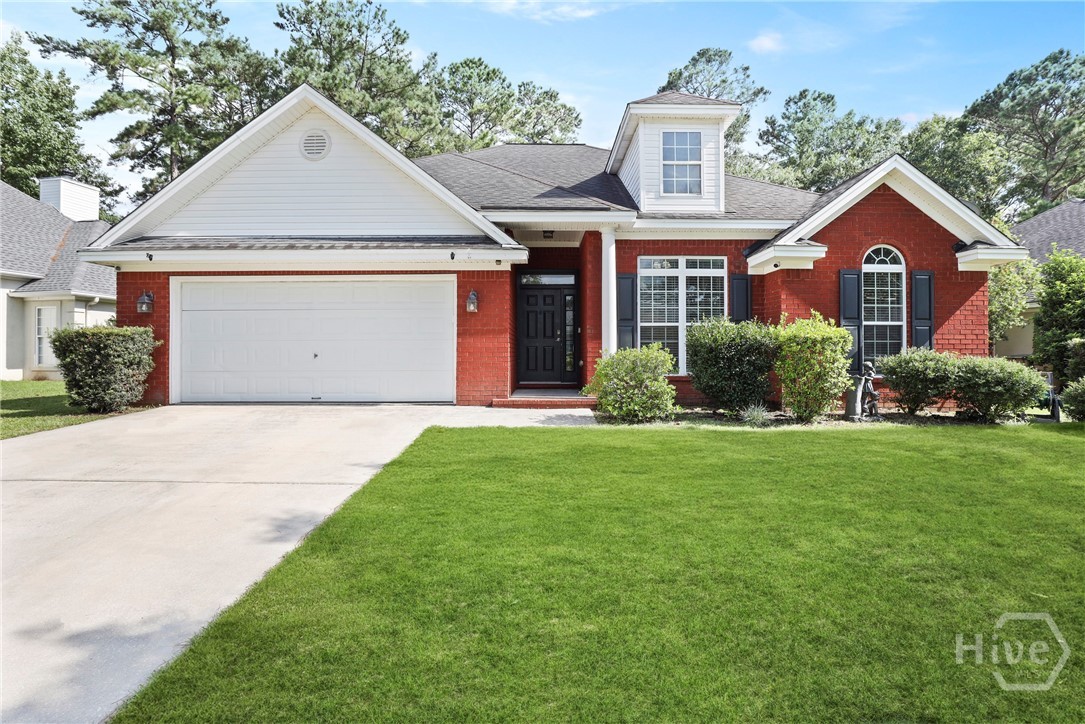
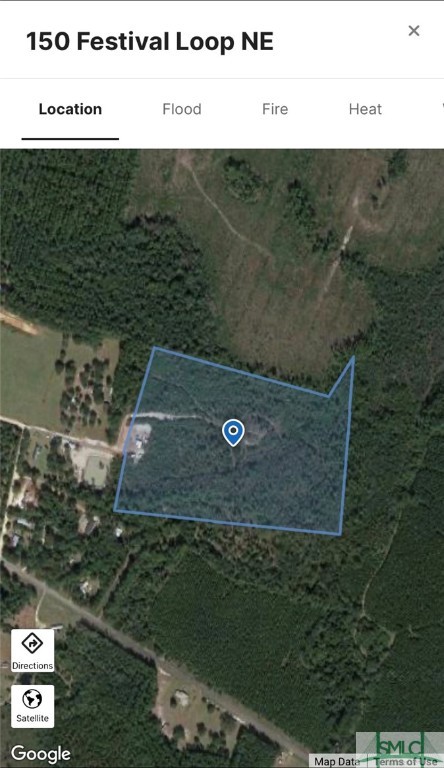
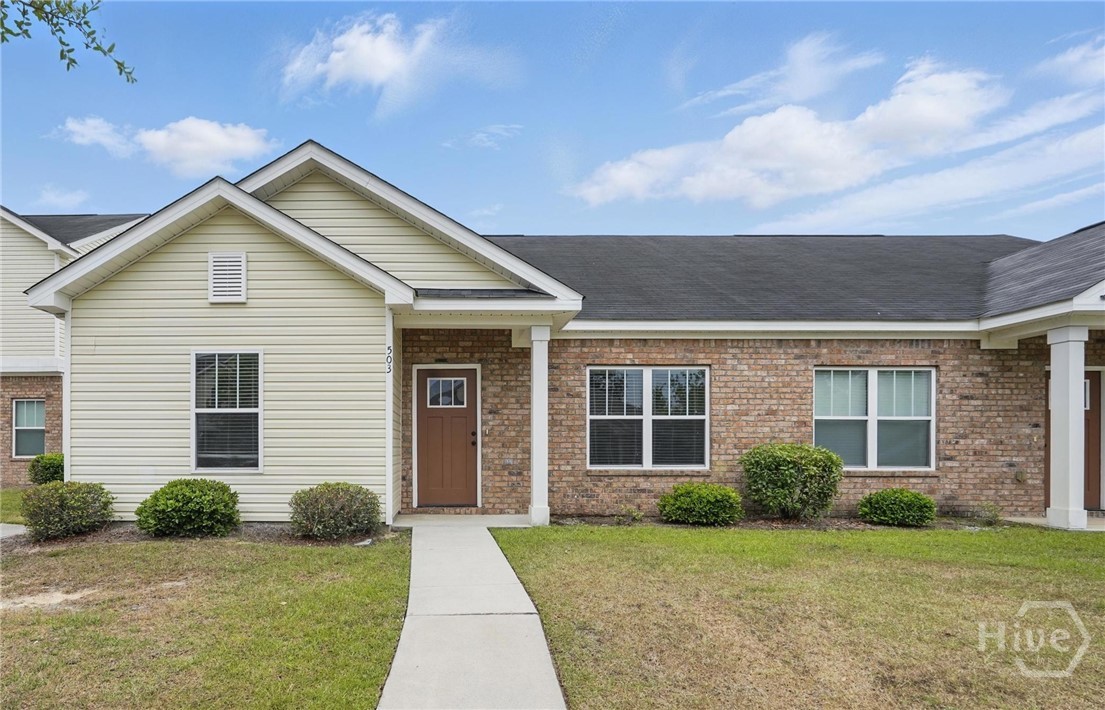
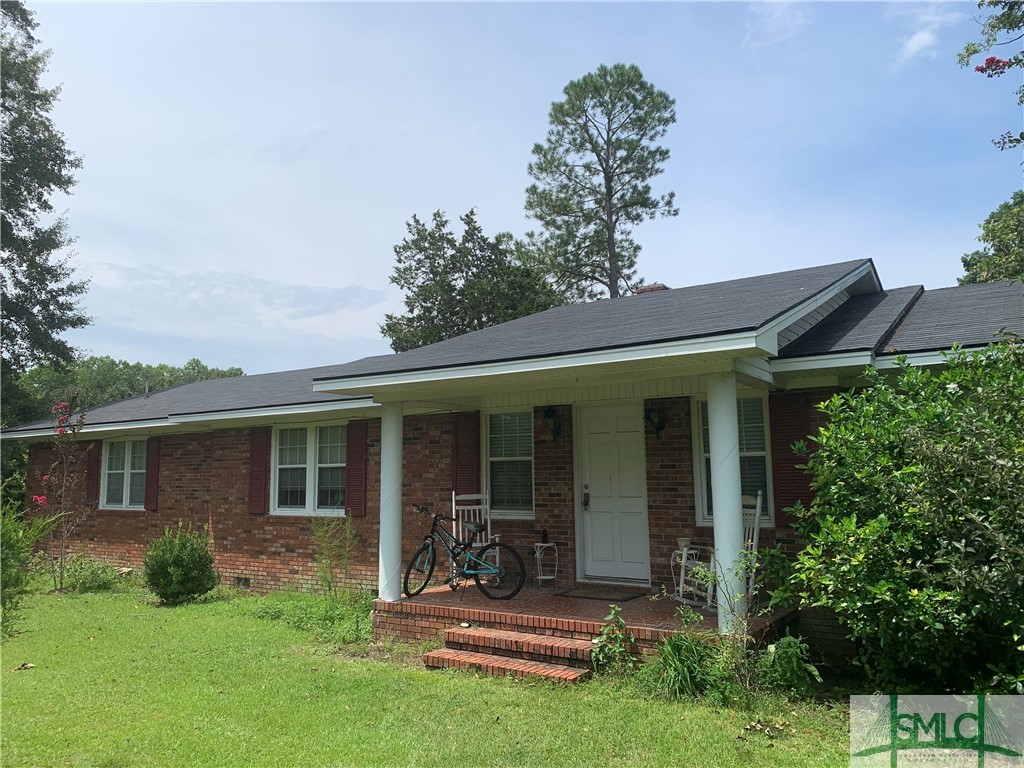
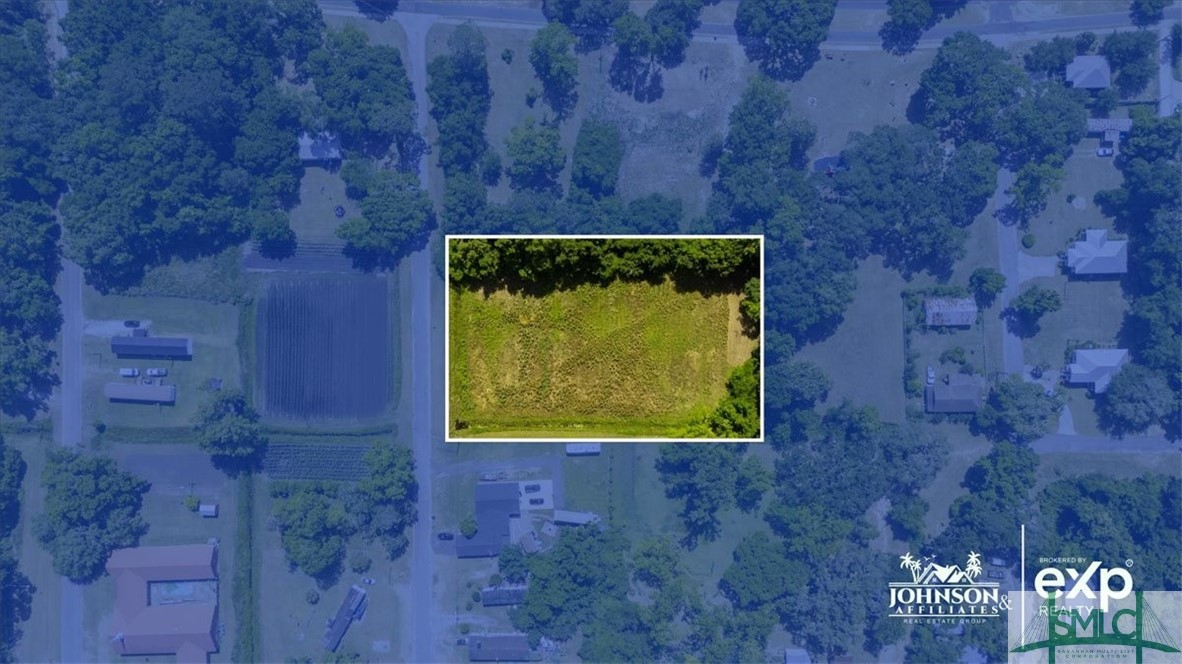
Explore Real Estate Opportunities in Hinesville, GA
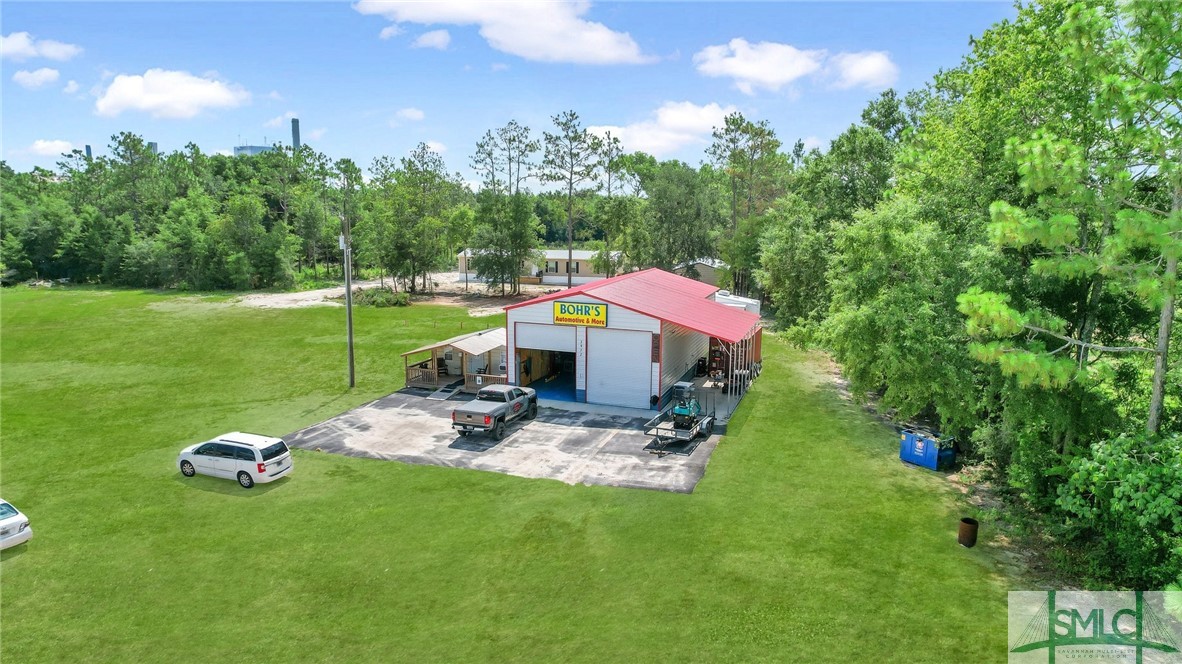
A very diverse and bustling military town.
42,034 people live in Hinesville, where the median age is 29.6 and the average individual income is $27,388. Data provided by the U.S. Census Bureau.
Total Population
Median Age
Population Density
Average individual Income
There's plenty to do around Hinesville, including shopping, dining, nightlife, parks, and more. Data provided by Walk Score and Yelp.
Explore popular things to do in the area, including Bless 4 Less BBQ and Seafood, Curry Express, and Dulce Delicia.
| Name | Category | Distance | Reviews |
Ratings by
Yelp
|
|---|---|---|---|---|
| Dining | 1.21 miles | 17 reviews | 4.9/5 stars | |
| Dining | 1.1 miles | 12 reviews | 4.8/5 stars | |
| Dining | 1.88 miles | 9 reviews | 4.7/5 stars | |
| Dining | 2.43 miles | 9 reviews | 4.6/5 stars | |
| Dining | 2.56 miles | 8 reviews | 4.5/5 stars | |
| Dining | 0.65 miles | 8 reviews | 4.5/5 stars | |
| Active | 4.97 miles | 5 reviews | 5/5 stars | |
| Active | 3.04 miles | 5 reviews | 4.6/5 stars | |
| Beauty | 1.28 miles | 7 reviews | 5/5 stars | |
| Beauty | 0.82 miles | 4 reviews | 5/5 stars | |
| Beauty | 1.07 miles | 4 reviews | 5/5 stars | |
| Beauty | 0.64 miles | 14 reviews | 4.7/5 stars | |
| Beauty | 0.98 miles | 16 reviews | 4.7/5 stars | |
| Beauty | 2.54 miles | 6 reviews | 4.7/5 stars | |
| Beauty | 0.45 miles | 3 reviews | 5/5 stars | |
| Beauty | 1.08 miles | 4 reviews | 4.8/5 stars | |
|
|
||||
|
|
||||
|
|
||||
|
|
||||
|
|
||||
|
|
Hinesville has 15,394 households, with an average household size of 2.71. Data provided by the U.S. Census Bureau. Here’s what the people living in Hinesville do for work — and how long it takes them to get there. Data provided by the U.S. Census Bureau. 42,034 people call Hinesville home. The population density is 688 and the largest age group is Data provided by the U.S. Census Bureau.
Total Population
Population Density Population Density This is the number of people per square mile in a neighborhood.
Median Age
Men vs Women
Population by Age Group
0-9 Years
10-17 Years
18-24 Years
25-64 Years
65-74 Years
75+ Years
Education Level
Total Households
Average Household Size
Average individual Income
Households with Children
With Children:
Without Children:
Blue vs White Collar Workers
Blue Collar:
White Collar:

11392 Ford Ave
Richmond Hill GA 31324
11392 Ford Ave
Richmond Hill GA 31324